


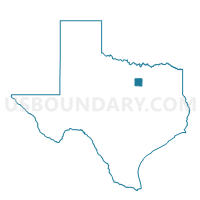
Arlington CCD, Tarrant County, Texas
About
Outline

Summary
| Unique Area Identifier | 154269 |
| Name | Arlington CCD |
| County | Tarrant County |
| State | Texas |
| Area (square miles) | 181.70 |
| Land Area (square miles) | 176.63 |
| Water Area (square miles) | 5.07 |
| % of Land Area | 97.21 |
| % of Water Area | 2.79 |
| Latitude of the Internal Point | 32.66673920 |
| Longtitude of the Internal Point | -97.12997720 |
| Total Population | 491,713 |
| Total Housing Units | 191,325 |
| Total Households | 176,807 |
| Median Age | 32.5 |
Maps

Graphs
Select a template below for downloading or customizing gragh for Arlington CCD, Tarrant County, Texas


Neighbors
Neighoring County Subdivision (by Name) Neighboring County Subdivision on the Map
- Alvarado CCD, Johnson County, TX
- Fort Worth CCD, Tarrant County, TX
- Midlothian CCD, Ellis County, TX
- Southwest Dallas CCD, Dallas County, TX
Top 10 Neighboring Place (by Population) Neighboring Place on the Map
- Fort Worth city, TX (741,206)
- Arlington city, TX (365,438)
- Grand Prairie city, TX (175,396)
- Mansfield city, TX (56,368)
- Rendon CDP, TX (12,552)
- Forest Hill city, TX (12,355)
- Kennedale city, TX (6,763)
- Pantego town, TX (2,394)
- Dalworthington Gardens city, TX (2,259)
Top 10 Neighboring Unified School District (by Population) Neighboring Unified School District on the Map
- Fort Worth Independent School District, TX (466,910)
- Arlington Independent School District, TX (341,201)
- Mansfield Independent School District, TX (138,558)
- Hurst-Euless-Bedford Independent School District, TX (137,578)
- Grand Prairie Independent School District, TX (121,843)
- Cedar Hill Independent School District, TX (45,362)
- Midlothian Independent School District, TX (32,577)
- Everman Independent School District, TX (22,395)
- Kennedale Independent School District, TX (17,898)
Top 10 Neighboring State Legislative District Lower Chamber (by Population) Neighboring State Legislative District Lower Chamber on the Map
- State House District 96, TX (231,782)
- State House District 10, TX (184,699)
- State House District 93, TX (179,024)
- State House District 58, TX (169,146)
- State House District 91, TX (164,484)
- State House District 106, TX (159,716)
- State House District 95, TX (155,511)
- State House District 92, TX (154,749)
- State House District 94, TX (143,509)
Top 10 Neighboring State Legislative District Upper Chamber (by Population) Neighboring State Legislative District Upper Chamber on the Map
- State Senate District 12, TX (1,013,641)
- State Senate District 10, TX (834,265)
- State Senate District 9, TX (807,907)
- State Senate District 22, TX (789,412)
Top 10 Neighboring 111th Congressional District (by Population) Neighboring 111th Congressional District on the Map
- Congressional District 26, TX (915,137)
- Congressional District 6, TX (809,095)
- Congressional District 24, TX (792,319)
- Congressional District 17, TX (760,042)
Top 10 Neighboring Census Tract (by Population) Neighboring Census Tract on the Map
- Census Tract 1115.47, Tarrant County, TX (15,275)
- Census Tract 1115.50, Tarrant County, TX (12,483)
- Census Tract 164.01, Dallas County, TX (9,995)
- Census Tract 1113.01, Tarrant County, TX (9,405)
- Census Tract 1115.39, Tarrant County, TX (8,945)
- Census Tract 164.11, Dallas County, TX (8,935)
- Census Tract 1115.23, Tarrant County, TX (8,743)
- Census Tract 1114.04, Tarrant County, TX (8,336)
- Census Tract 1115.21, Tarrant County, TX (8,270)
- Census Tract 1304.07, Johnson County, TX (7,992)
Top 10 Neighboring 5-Digit ZIP Code Tabulation Area (by Population) Neighboring 5-Digit ZIP Code Tabulation Area on the Map
- 75052, TX (88,996)
- 76063, TX (61,361)
- 76028, TX (59,744)
- 76010, TX (55,706)
- 75104, TX (45,373)
- 76017, TX (44,724)
- 76119, TX (42,761)
- 75050, TX (41,041)
- 75051, TX (39,285)
- 76112, TX (38,993)
Data
Demographic, Population, Households, and Housing Units
** Data sources from census 2010 **
Show Data on Map
Download Full List as CSV
Download Quick Sheet as CSV
| Subject | This Area | Tarrant County | Texas | National |
|---|---|---|---|---|
| POPULATION | ||||
| Total Population Map | 491,713 | 1,809,034 | 25,145,561 | 308,745,538 |
| POPULATION, HISPANIC OR LATINO ORIGIN | ||||
| Not Hispanic or Latino Map | 367,461 | 1,326,057 | 15,684,640 | 258,267,944 |
| Hispanic or Latino Map | 124,252 | 482,977 | 9,460,921 | 50,477,594 |
| POPULATION, RACE | ||||
| White alone Map | 294,579 | 1,205,530 | 17,701,552 | 223,553,265 |
| Black or African American alone Map | 94,106 | 268,983 | 2,979,598 | 38,929,319 |
| American Indian and Alaska Native alone Map | 3,158 | 11,827 | 170,972 | 2,932,248 |
| Asian alone Map | 33,182 | 84,561 | 964,596 | 14,674,252 |
| Native Hawaiian and Other Pacific Islander alone Map | 517 | 3,184 | 21,656 | 540,013 |
| Some Other Race alone Map | 50,237 | 180,672 | 2,628,186 | 19,107,368 |
| Two or More Races Map | 15,934 | 54,277 | 679,001 | 9,009,073 |
| POPULATION, SEX | ||||
| Male Map | 241,341 | 887,235 | 12,472,280 | 151,781,326 |
| Female Map | 250,372 | 921,799 | 12,673,281 | 156,964,212 |
| POPULATION, AGE (18 YEARS) | ||||
| 18 years and over Map | 352,081 | 1,301,973 | 18,279,737 | 234,564,071 |
| Under 18 years | 139,632 | 507,061 | 6,865,824 | 74,181,467 |
| POPULATION, AGE | ||||
| Under 5 years | 38,112 | 142,899 | 1,928,473 | 20,201,362 |
| 5 to 9 years | 39,605 | 144,307 | 1,928,234 | 20,348,657 |
| 10 to 14 years | 38,820 | 138,666 | 1,881,883 | 20,677,194 |
| 15 to 17 years | 23,095 | 81,189 | 1,127,234 | 12,954,254 |
| 18 and 19 years | 14,638 | 49,674 | 755,890 | 9,086,089 |
| 20 years | 7,172 | 23,727 | 369,040 | 4,519,129 |
| 21 years | 7,112 | 23,752 | 359,015 | 4,354,294 |
| 22 to 24 years | 22,163 | 75,698 | 1,089,024 | 12,712,576 |
| 25 to 29 years | 37,230 | 136,502 | 1,853,039 | 21,101,849 |
| 30 to 34 years | 35,545 | 130,048 | 1,760,434 | 19,962,099 |
| 35 to 39 years | 37,151 | 132,916 | 1,763,587 | 20,179,642 |
| 40 to 44 years | 36,745 | 130,646 | 1,694,795 | 20,890,964 |
| 45 to 49 years | 36,694 | 134,453 | 1,760,467 | 22,708,591 |
| 50 to 54 years | 32,816 | 123,488 | 1,674,869 | 22,298,125 |
| 55 to 59 years | 25,781 | 99,554 | 1,422,924 | 19,664,805 |
| 60 and 61 years | 8,903 | 34,210 | 500,523 | 7,113,727 |
| 62 to 64 years | 11,777 | 45,920 | 674,244 | 9,704,197 |
| 65 and 66 years | 6,240 | 24,355 | 373,062 | 5,319,902 |
| 67 to 69 years | 7,627 | 30,133 | 480,038 | 7,115,361 |
| 70 to 74 years | 9,019 | 37,317 | 619,156 | 9,278,166 |
| 75 to 79 years | 6,776 | 29,141 | 477,245 | 7,317,795 |
| 80 to 84 years | 4,653 | 20,972 | 347,206 | 5,743,327 |
| 85 years and over | 4,039 | 19,467 | 305,179 | 5,493,433 |
| MEDIAN AGE BY SEX | ||||
| Both sexes Map | 32.50 | 33.40 | 33.60 | 37.20 |
| Male Map | 31.50 | 32.40 | 32.60 | 35.80 |
| Female Map | 33.40 | 34.30 | 34.60 | 38.50 |
| HOUSEHOLDS | ||||
| Total Households Map | 176,807 | 657,134 | 8,922,933 | 116,716,292 |
| HOUSEHOLDS, HOUSEHOLD TYPE | ||||
| Family households: Map | 123,955 | 455,033 | 6,237,148 | 77,538,296 |
| Husband-wife family Map | 88,855 | 329,737 | 4,515,013 | 56,510,377 |
| Other family: Map | 35,100 | 125,296 | 1,722,135 | 21,027,919 |
| Male householder, no wife present Map | 9,552 | 34,350 | 467,431 | 5,777,570 |
| Female householder, no husband present Map | 25,548 | 90,946 | 1,254,704 | 15,250,349 |
| Nonfamily households: Map | 52,852 | 202,101 | 2,685,785 | 39,177,996 |
| Householder living alone Map | 41,883 | 163,559 | 2,163,266 | 31,204,909 |
| Householder not living alone Map | 10,969 | 38,542 | 522,519 | 7,973,087 |
| HOUSEHOLDS, HISPANIC OR LATINO ORIGIN OF HOUSEHOLDER | ||||
| Not Hispanic or Latino householder: Map | 143,804 | 530,452 | 6,308,776 | 103,254,926 |
| Hispanic or Latino householder: Map | 33,003 | 126,682 | 2,614,157 | 13,461,366 |
| HOUSEHOLDS, RACE OF HOUSEHOLDER | ||||
| Householder who is White alone | 113,479 | 465,500 | 6,570,152 | 89,754,352 |
| Householder who is Black or African American alone | 34,899 | 100,525 | 1,088,836 | 14,129,983 |
| Householder who is American Indian and Alaska Native alone | 1,058 | 4,004 | 57,265 | 939,707 |
| Householder who is Asian alone | 9,828 | 25,307 | 307,373 | 4,632,164 |
| Householder who is Native Hawaiian and Other Pacific Islander alone | 141 | 769 | 6,353 | 143,932 |
| Householder who is Some Other Race alone | 13,539 | 47,766 | 714,396 | 4,916,427 |
| Householder who is Two or More Races | 3,863 | 13,263 | 178,558 | 2,199,727 |
| HOUSEHOLDS, HOUSEHOLD TYPE BY HOUSEHOLD SIZE | ||||
| Family households: Map | 123,955 | 455,033 | 6,237,148 | 77,538,296 |
| 2-person household Map | 43,188 | 163,909 | 2,283,002 | 31,882,616 |
| 3-person household Map | 29,860 | 107,256 | 1,417,977 | 17,765,829 |
| 4-person household Map | 26,924 | 96,698 | 1,286,463 | 15,214,075 |
| 5-person household Map | 13,990 | 50,605 | 709,450 | 7,411,997 |
| 6-person household Map | 5,926 | 21,398 | 307,995 | 3,026,278 |
| 7-or-more-person household Map | 4,067 | 15,167 | 232,261 | 2,237,501 |
| Nonfamily households: Map | 52,852 | 202,101 | 2,685,785 | 39,177,996 |
| 1-person household Map | 41,883 | 163,559 | 2,163,266 | 31,204,909 |
| 2-person household Map | 8,807 | 31,559 | 420,415 | 6,360,012 |
| 3-person household Map | 1,332 | 4,446 | 64,352 | 992,156 |
| 4-person household Map | 595 | 1,741 | 26,532 | 411,171 |
| 5-person household Map | 152 | 497 | 6,926 | 126,634 |
| 6-person household Map | 57 | 185 | 2,610 | 48,421 |
| 7-or-more-person household Map | 26 | 114 | 1,684 | 34,693 |
| HOUSING UNITS | ||||
| Total Housing Units Map | 191,325 | 714,803 | 9,977,436 | 131,704,730 |
| HOUSING UNITS, OCCUPANCY STATUS | ||||
| Occupied Map | 176,807 | 657,134 | 8,922,933 | 116,716,292 |
| Vacant Map | 14,518 | 57,669 | 1,054,503 | 14,988,438 |
| HOUSING UNITS, OCCUPIED, TENURE | ||||
| Owned with a mortgage or a loan Map | 84,562 | 309,193 | 3,728,987 | 52,979,430 |
| Owned free and clear Map | 21,824 | 99,631 | 1,956,366 | 23,006,644 |
| Renter occupied Map | 70,421 | 248,310 | 3,237,580 | 40,730,218 |
| HOUSING UNITS, VACANT, VACANCY STATUS | ||||
| For rent Map | 9,544 | 33,204 | 394,310 | 4,137,567 |
| Rented, not occupied Map | 250 | 1,094 | 16,509 | 206,825 |
| For sale only Map | 1,954 | 8,478 | 121,430 | 1,896,796 |
| Sold, not occupied Map | 294 | 1,389 | 30,437 | 421,032 |
| For seasonal, recreational, or occasional use Map | 559 | 2,494 | 208,733 | 4,649,298 |
| For migrant workers Map | 1 | 14 | 2,209 | 24,161 |
| Other vacant Map | 1,916 | 10,996 | 280,875 | 3,652,759 |
| HOUSING UNITS, OCCUPIED, AVERAGE HOUSEHOLD SIZE BY TENURE | ||||
| Total: Map | 2.76 | 2.72 | 2.75 | 2.58 |
| Owner occupied Map | 2.94 | 2.88 | 2.87 | 2.65 |
| Renter occupied Map | 2.50 | 2.46 | 2.54 | 2.44 |
| HOUSING UNITS, OCCUPIED, TENURE BY RACE OF HOUSEHOLDER | ||||
| Owner occupied: Map | 106,386 | 408,824 | 5,685,353 | 75,986,074 |
| Householder who is White alone Map | 77,552 | 316,502 | 4,517,967 | 63,446,275 |
| Householder who is Black or African American alone Map | 14,039 | 42,461 | 486,371 | 6,261,464 |
| Householder who is American Indian and Alaska Native alone Map | 585 | 2,299 | 32,734 | 509,588 |
| Householder who is Asian alone Map | 6,348 | 16,294 | 190,121 | 2,688,861 |
| Householder who is Native Hawaiian and Other Pacific Islander alone Map | 68 | 369 | 3,003 | 61,911 |
| Householder who is Some Other Race alone Map | 5,986 | 24,169 | 361,514 | 1,975,817 |
| Householder who is Two or More Races Map | 1,808 | 6,730 | 93,643 | 1,042,158 |
| Renter occupied: Map | 70,421 | 248,310 | 3,237,580 | 40,730,218 |
| Householder who is White alone Map | 35,927 | 148,998 | 2,052,185 | 26,308,077 |
| Householder who is Black or African American alone Map | 20,860 | 58,064 | 602,465 | 7,868,519 |
| Householder who is American Indian and Alaska Native alone Map | 473 | 1,705 | 24,531 | 430,119 |
| Householder who is Asian alone Map | 3,480 | 9,013 | 117,252 | 1,943,303 |
| Householder who is Native Hawaiian and Other Pacific Islander alone Map | 73 | 400 | 3,350 | 82,021 |
| Householder who is Some Other Race alone Map | 7,553 | 23,597 | 352,882 | 2,940,610 |
| Householder who is Two or More Races Map | 2,055 | 6,533 | 84,915 | 1,157,569 |
| HOUSING UNITS, OCCUPIED, TENURE BY HISPANIC OR LATINO ORIGIN OF HOUSEHOLDER | ||||
| Owner occupied: Map | 106,386 | 408,824 | 5,685,353 | 75,986,074 |
| Not Hispanic or Latino householder Map | 90,296 | 339,364 | 4,175,029 | 69,617,625 |
| Hispanic or Latino householder Map | 16,090 | 69,460 | 1,510,324 | 6,368,449 |
| Renter occupied: Map | 70,421 | 248,310 | 3,237,580 | 40,730,218 |
| Not Hispanic or Latino householder Map | 53,508 | 191,088 | 2,133,747 | 33,637,301 |
| Hispanic or Latino householder Map | 16,913 | 57,222 | 1,103,833 | 7,092,917 |
| HOUSING UNITS, OCCUPIED, TENURE BY HOUSEHOLD SIZE | ||||
| Owner occupied: Map | 106,386 | 408,824 | 5,685,353 | 75,986,074 |
| 1-person household Map | 17,275 | 72,342 | 1,047,772 | 16,453,569 |
| 2-person household Map | 34,239 | 133,813 | 1,900,981 | 27,618,605 |
| 3-person household Map | 19,958 | 73,981 | 975,846 | 12,517,563 |
| 4-person household Map | 18,983 | 69,608 | 911,187 | 10,998,793 |
| 5-person household Map | 9,439 | 34,995 | 486,511 | 5,057,765 |
| 6-person household Map | 3,896 | 14,251 | 207,414 | 1,965,796 |
| 7-or-more-person household Map | 2,596 | 9,834 | 155,642 | 1,373,983 |
| Renter occupied: Map | 70,421 | 248,310 | 3,237,580 | 40,730,218 |
| 1-person household Map | 24,608 | 91,217 | 1,115,494 | 14,751,340 |
| 2-person household Map | 17,756 | 61,655 | 802,436 | 10,624,023 |
| 3-person household Map | 11,234 | 37,721 | 506,483 | 6,240,422 |
| 4-person household Map | 8,536 | 28,831 | 401,808 | 4,626,453 |
| 5-person household Map | 4,703 | 16,107 | 229,865 | 2,480,866 |
| 6-person household Map | 2,087 | 7,332 | 103,191 | 1,108,903 |
| 7-or-more-person household Map | 1,497 | 5,447 | 78,303 | 898,211 |
Loading...